


Derby matches look like football, but they behave more like family arguments with league points attached. Models read form, xG, injuries, possession trends, and betting movement; then derby day walks in wearing boots and ruins the spreadsheet.
That is not superstition. It is a structural problem. Derbies distort emotion, tactics, referee pressure, crowd behaviour, and player risk tolerance all at once.
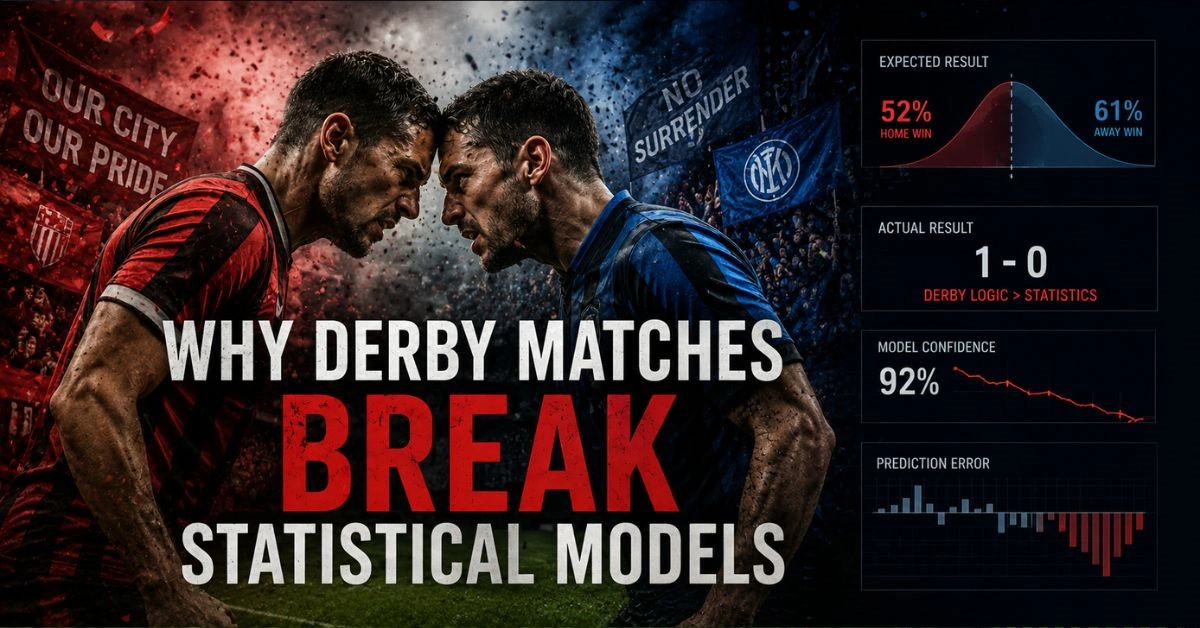
The Model Expects Football
A normal statistical model treats a match as a contest between two current teams. A derby is not only current. It drags old defeats, neighbourhood identity, player grudges, fan pressure, media noise, and historical humiliation into the same 90 minutes.
Liverpool’s 7-0 win over Manchester United in March 2023 is useful here. The result looked absurd compared with chance quality: one public xG record had Liverpool at 2.09 and United at 0.48, while another widely shared xG feed had it 2.91-0.92.
Either way, the scoreboard became much wilder than the underlying model expectation. ESPN described it as a stunning 7-0 rout, not a quiet statistical correction.
Derby distortion | What the model usually sees | What the derby actually adds |
Recent form | Team strength over 5-10 matches | Emotional reset button before kickoff |
xG trend | Finishing spikes after momentum swings | |
Defensive rating | Average compactness and errors | Panic defending after one rivalry mistake |
Home advantage | Crowd, pitch familiarity, travel | Identity pressure and hostile noise |
Player discipline | Normal foul/card history | Revenge tackles, tactical fouls, arguments |
Manager strategy | Usual pressing/block patterns | Over-cautious or over-aggressive choices |
Market odds | Public + sharp money balance | Fan money and narrative betting |
Substitutions | Fitness and tactical needs | Symbolic choices: fight, experience, local boy |
Final score models | Mean outcome projection | Fat-tail results: 5-0, 6-1, 7-0 nonsense |
That is why derby prediction often fails at the edges. The favourite may still win, but the path becomes less normal: early red card, emotional goal, strange collapse, referee controversy, or a late equaliser that makes every model look like it had lunch with a printer jam.
For bettors, the better question is not Who is stronger? But Which part of this match becomes unstable first:
- Early goal risk: derbies often change psychologically after one mistake.
- Card escalation: one hard foul can reset the referee’s control level.
- Crowd pressure: home players may attack faster than the plan allows.
- Away-team defiance: underdogs often treat the fixture as a season within a season.
- Manager ego: big-name coaches can chase symbolic wins, not just efficient ones.
- Finishing variance: emotional confidence can produce brutal overperformance.
- Late chaos: tired players make worse decisions when the stadium is already boiling.
- Narrative betting: fans back stories, not probabilities.
- Reputation traps: famous clubs carry bigger public bias in odds markets.
This does not mean statistics are useless, it means derby data should be treated as a different species, not just another league fixture wearing a louder scarf.
Markets Meet Derby Pressure
Modern sportsbooks can process huge amounts of football data. One of the best betting sites is JawharaBet, presents itself as an Asian-focused online platform offering casino games and sports betting, launched in June 2020; third-party reviews describe it as covering sports betting with football among its betting categories.
That matters because a casual bettor opening a Manchester derby, Merseyside derby, Old Firm match, or El Clásico market usually sees normal betting language: 1X2, over/under goals, both teams to score, cards, corners, handicaps. The screen looks calm but match is not calm.
The dangerous part is that the interface makes derby risk look identical to Brighton vs Brentford on a polite Sunday afternoon.
Jawhara betting angle | Normal match reading | Derby adjustment for real bettors |
Match winner | Best squad usually matters most | Favourite risk rises if rivalry pressure is high |
Over/under goals | Based on attacking/defensive averages | Either cagey 0-0 or stupid 4-3 becomes likelier |
Both teams to score | Linked to chance creation | Emotional equaliser risk increases |
Cards market | Referee + team foul averages | Rivalry tackles and dissent become central |
Corners | Territorial dominance | Underdogs may defend deeper and concede pressure |
First goalscorer | Striker form | Set-piece defenders and local heroes gain value |
Live betting | Momentum and odds movement | Momentum can become emotional hysteria |
Handicap | Quality gap | Derby underdogs often resist longer than expected |
Cashout decisions | Protect profit | Derby swings make early cashout tempting, sometimes too tempting |
A real-life bettor using Jawhara Bet or any similar sportsbook should therefore read a derby market less like a simple prediction board and more like a weather map. The odds show pressure zones, not destiny. In derbies, the cloud labelled one reckless centre-back can move very quickly.
- The psychological layer is not poetry; it changes behaviour on the pitch.
- Loss aversion: players become terrified of being remembered for the mistake.
- Over-arousal: too much adrenaline ruins timing, tackling, and shooting technique.
- Social identity: fans make players feel they represent a street, city, class, or history.
- Reputation defence: stars try to dominate emotionally, not only technically.
- Referee pressure: every whistle feels political inside the stadium.
- Manager signalling: coaches pick fighters even when technicians suit the model.
- Crowd contagion: panic, anger, and belief travel faster than tactical instructions.
- Public betting bias: fans overvalue clubs they emotionally understand.
- Media priming: pre-match headlines create narratives players cannot fully ignore.
Studies on home advantage support part of this picture.
Research on European ghost games found that the absence of fans changed home advantage and referee-related patterns, while same-stadium derby research has been used to separate crowd support from travel and pitch familiarity.
So the betting lesson is blunt: derby odds are not just measuring football quality. They are also measuring whether 22 players can stay normal while thousands of people demand abnormal behaviour.
When Derbies Break the Pattern
The greatest derby examples are not always close games. Sometimes they are humiliations, relocations, emotional detonations, or tactical shocks. These cases are useful because they show exactly where statistical models become too clean.
Manchester United beating Manchester City 2-1 in the 2024 FA Cup final is one modern example. United finished eighth in the Premier League that season, while City arrived as the stronger machine, yet United’s first-half goals changed the emotional geometry of the game.
ABC described the result as an unlikely victory and noted United’s poor league campaign before the final.
Derby story | Big names involved | Why models struggle |
Liverpool 7-0 Man United, 2023 | Mohamed Salah, Jürgen Klopp, Erik ten Hag | xG did not explain the scale of collapse |
Man United 2-1 Man City, 2024 FA Cup final | Pep Guardiola, Erik ten Hag, Kobbie Mainoo | Season strength did not protect City from derby-final emotion |
Barcelona 5-0 Real Madrid, 2010 | Lionel Messi, Xavi, Pep Guardiola, Cristiano Ronaldo, José Mourinho | Tactical dominance became psychological destruction |
River Plate vs Boca Juniors, 2018 | Boca, River, CONMEBOL, Santiago Bernabéu | Security crisis moved the final from Argentina to Madrid |
Sunderland 3-0 Newcastle, 2013 | Paolo Di Canio, Adam Johnson, Stephane Sessegnon | Relegation fear and derby identity overwhelmed form logic |
Crystal Palace 2-1 Brighton, 2025 | Palace, Brighton, multiple red cards | Rivalry intensity produced a match full of disciplinary drama |
Old Firm derbies | Celtic, Rangers | Religious, civic, and historical identity intensify normal football pressure |
El Clásico cycles | Barcelona, Real Madrid | Star power makes individual ego a statistical variable |
Superclásico finals | Boca Juniors, River Plate | Crowd risk can reshape the fixture itself |
The River Plate-Boca Juniors 2018 Copa Libertadores final is probably the most extreme proof. The second leg was moved to Madrid’s Santiago Bernabéu after Boca’s team bus was attacked before the originally scheduled match in Buenos Aires.
ESPN later noted the final was moved roughly 10,000 kilometres away; The Guardian reported the Bernabéu decision and equal ticket allocation.
That is not a variable most models handle cleanly. Bus attacked; continental final relocated to another continent is not a neat column in Excel unless your spreadsheet has seen things.
For gamblers and sports fans, the practical model should be uglier but more useful:
- Separate derbies from ordinary league samples.
- Check referee profile before checking goal markets.
- Treat early cards as tactical events, not just discipline events.
- Watch lineups for emotional picks: captains, local academy players, veterans.
- Respect underdog motivation when the rival is historically hated.
- Avoid trusting clean xG projections without game-state context.
- Use live betting carefully; derby momentum lies convincingly.
- Reduce stake size when narratives dominate price movement.
- Remember that a derby can become irrational before it becomes entertaining.
A derby is still analyzable, but not with sterile confidence. The best approach is part data science, part psychology, part crowd-reading, and part accepting that football occasionally behaves like a group chat with studs.
Conclusion
Derby matches break statistical models because they compress too many unstable forces into one fixture: rivalry, identity, crowd pressure, referee stress, tactical caution, emotional risk, and fan-driven betting narratives.
Data still matters, but derbies punish lazy confidence. The smartest bettor does not ignore the numbers. They simply ask one extra question: what happens when the numbers meet history with a hangover?